Posts
Significant and Not Significant Are Not Significantly Different
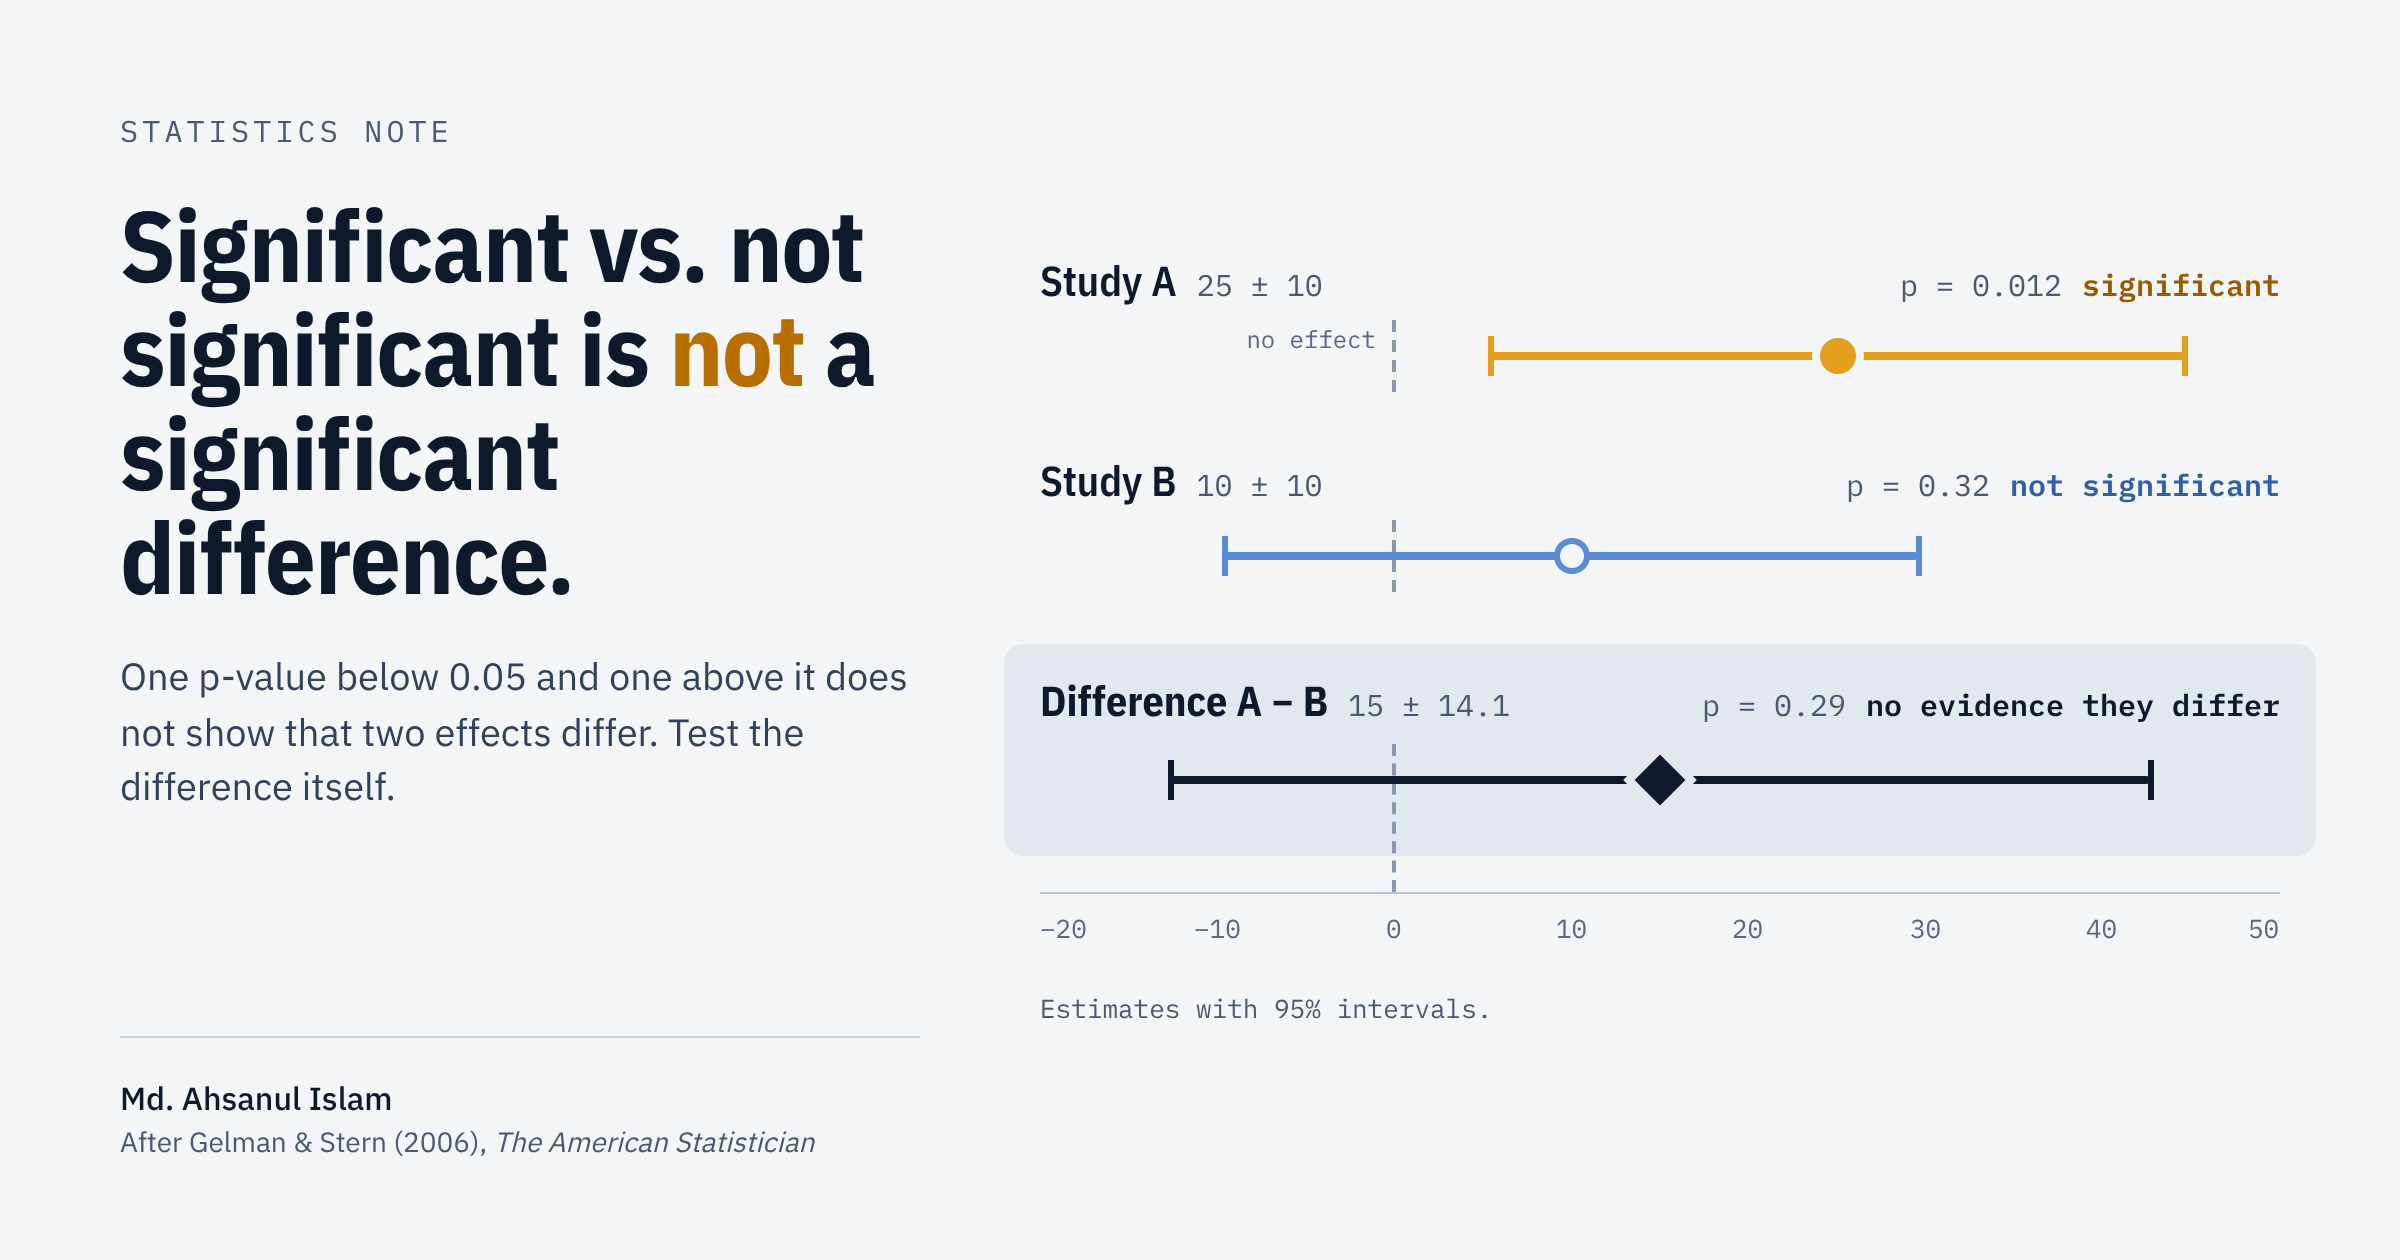
One significant result and one nonsignificant result do not show that two effects differ. Test the difference itself, and here is how to do it in R.
Design Your Environment, Design Your Life
Stop relying on willpower alone. Learn how to architect your environment to make success your default setting.
50 Journals used in the FT Research Rank
The FT50 list is a compilation of 50 prestigious academic and practitioner journals used by the Financial Times to calculate the Research Rank for various MBA and business school rankings. Journals are chosen based on their perceived quality, impact, and relevance to the business school community. …
The Statistical Civil War of Estimation: Frequentists, Bayesians, and …
Today, estimation techniques sit quietly at the center of nearly every data-driven decision, from machine learning models predicting consumer choices to epidemiological simulations projecting disease spread. In the era of high-level programming, however, we rarely look beneath the hood. We treat …

Cluster Analysis
Explore the fascinating world of cluster analysis using R. Discover various clustering techniques, such as hierarchical clustering, k-means clustering, and more, as you delve into the process of grouping similar observations together to uncover patterns and structures in your data.

MANOVA Analysis: Unveiling Multivariate Patterns with R and Python
Learn about the fundamental concepts of MANOVA in R and Python.
Use R in Jupyter Notebook
In this post, I have showed complete procedure of enabling R kernal for Jupyter Notebook, so that you can use R in Jupyter Notebook.

The Kaplan-Meier Estimatior in R
In this post, we will see how to estimate the survival function in this method using R. Note that, the Kaplan–Meier estimator, often known as the product limit estimator, is a non-parametric statistic used to estimate the survival function using lifetime...

Recommended Books For Multivariate Analysis
Nothing is better resource than a book. So, in this post, I've shared some books that have been extremely helpful to me in my quest to learn multivariate analysis.

Shapiro Wilk Test using R
Samuel Sanford Shapiro and Martin Wilk developed a non-parametric test in 1965 to check the normality of the data, which was later named after them as Shapiro-Wilk test.

Principal Component Analysis - Theory and Application with R
PCA is a technique to transform the original set of variables into a smaller set of linear combination of variables so that most of the statistical information is preserved by those linear combinations. Before diving into the PCA, there are a few things one should be aware of...

পরিসংখ্যান সাবজেক্ট রিভিউ
বেশীরভাগ স্টুডেন্টেরই এই সাবজেক্ট নিয়ে খুব একটা ধারণা নেই। সত্যি বলতে ভর্তির আগে আমি নিজেও খুব বেশী কিছু জানতাম না এই সাবজেক্ট নিয়ে। এমনকি ব্যাবসায় শিক্ষার স্টুডেন্টদের এটা পড়তে দেখে ভাবতাম এটা ওদের সাবজেক্ট, সায়েন্সের না...

Complete guide to bar plot using ggplot2
R is great for data visualization. One of the amazing packages in visualization in R is the ggplot2. Hadley Wickham created ggplot2 in 2005 as an implementation of Leland Wilkinson's Grammar of Graphics. It divides graphs into semantic components like scales ...

Complete guide to scatter plot using ggplot2
R is great for data visualization. One of the amazing packages in visualization in R is the ggplot2. Hadley Wickham created ggplot2 in 2005 as an implementation of Leland Wilkinson's Grammar of Graphics. It divides graphs into semantic components like scales ...

Markov Chain - A Practical Example
Markov Chain is a special type of stochastic process. It is a popular and straightforward way to statistically model a discrete-time, discrete space stochastic processes.